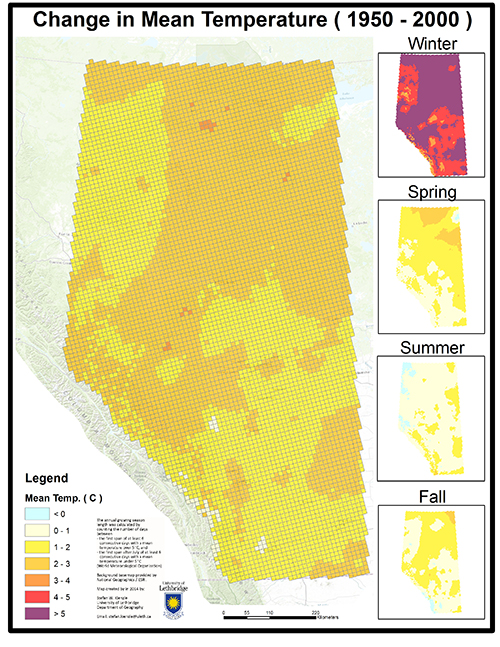
A new, interactive online database developed at the University of Lethbridge provides easy access to climate records from 1950 to 2010 for the province of Alberta. Analyzing the trends clearly reveals that Alberta’s climate has been warming, especially in winter, when the temperature in some areas has increased, on average, by as much as seven degrees.
“Our winters are clearly getting much, much warmer. It’s getting warmer faster in the north than the south and this is all based on observed data,” says Dr. Stefan Kienzle, a U of L geography professor who analyzed the database. “Interestingly, the summer temperatures have increased the least. On average, the summer temperature has gone up by less than one degree, rarely more than that. Spring temperatures have also risen by less than one degree in southern Alberta, but in northern Alberta there are regions with more than two degrees of increased warming.”

The dataset was developed by the National Land and Water Information Service, which is part of Agriculture and Agri-Food Canada. Using the measurements taken by weather stations across Alberta since 1950, Kienzle and his students analyzed the daily temperature readings to uncover trends in temperature changes.
The information on six climate indices is now available to the public through the Alberta Climate Records website. The measures include growing season, heat waves, days over 25 C, frost days, full days below 0 C, and days below –25 C.
“My main motivation in putting this together was to find out how much the climate has changed in Alberta based on the historically observed record,” he says. “I thought the public would be interested because we have all these different anecdotes about winter; some say winters are just as cold and others say they are warmer. In this case, our temperature records don’t lie.”
Weather is the atmospheric condition that can be observed and measured at a location, such as temperature, precipitation, wind or sunshine, while climate is the long-term statistics of weather, typically a 30-year average of weather.
“In central Alberta, the growing season has changed significantly,” says Kienzle. “Growing seasons throughout Alberta have lengthened, on average, by between three and four weeks because of earlier springs and later falls. For the farmers, that means there will be certain areas in Alberta where now the growing season is long enough for certain crops that couldn’t be grown before. You can also grow a larger variety of crops.”
However, the growing season can still vary significantly annually, depending on the weather conditions during that year. While farmers may benefit from a longer growing season on average, climate change also comes with significant downsides.
“The risks are more extreme weather, which means more heavy rainstorms which can cause flooding, more hail storms, more wind storms, and more lightning. More lightning, combined with more wind and dry ground, means more risk of wild fires. And for farmers, there’s an increased risk of pests and diseases,” he says.
Website users can click on a square on the map to bring up the climate data for that area of land. Each grid cell, identified by latitude and longitude, represents an area that is 10 by 10 kilometres. The database has almost 7,000 grid cells. Christine Clark, a new media graduate student, developed the webpage as part of her master’s thesis. Soon 43 climate variables will be available and the website will eventually be hosted through the U of L Library.
