| Distributed Stations | |||||||
|
|
|||||||
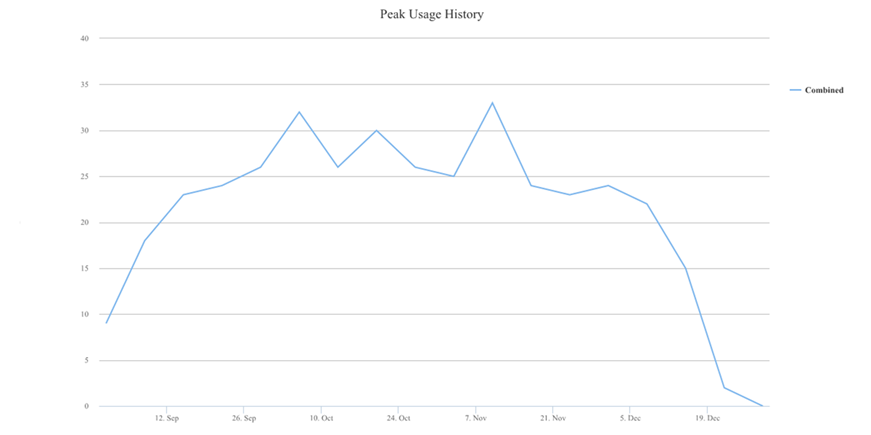
| <Insert Max Concurrent Usage graph (day of the week)> | |||||||
| Unique Users | Logins | Total Usage (hours) | Avg Duration (hours) | Stations Used (Total: 91)[1] | |||
| September | 508 | 2006 | 2270 | 1.13 | 89 | ||
| October | 594 | 2986 | 4342 | 1.45 | 90 | ||
| November | 503 | 2170 | 3050 | 1.41 | 90 | ||
| December | 338 | 1200 | 1918 | 1.60 | 86 | ||
| Total | 1086 | 8362 | 11580 | 1.39 | 90[2] | ||