| Distributed Stations | ||||||
|
|
||||||
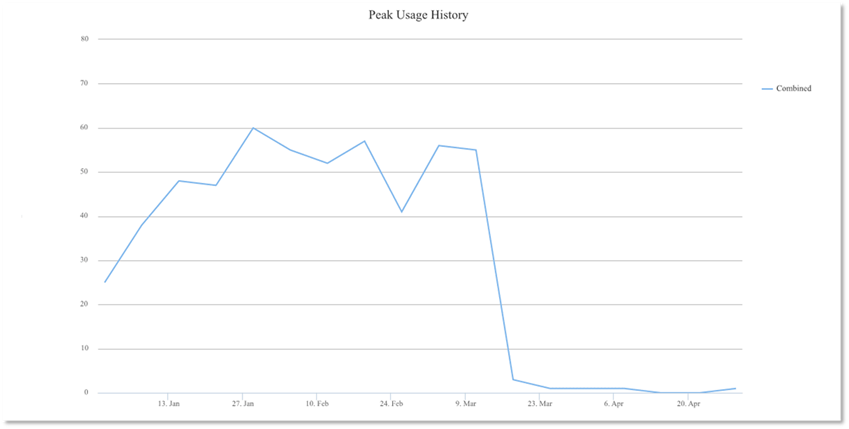
| <Insert Max Concurrent Usage graph (day of the week)> | ||||||
| Unique Users | Logins | Total Usage (hours) | Avg Duration (hours) | Stations Used (Total: 103)[1] | ||
| January | 1070 | 3763 | 6319 | 1.68 | 98 | |
| February | 1091 | 3831 | 7806 | 2.04 | 100 | |
| March[2] | 732 | 2128 | 4099 | 1.93 | 96 | |
| April | 2 | 2 | 0.45 | 0.23 | 2 | |
| Total | 1691[3] | 9724 | 18224.45 | 1.88[4] | 100[5] | |