| Distributed Stations |
|
||||||||||
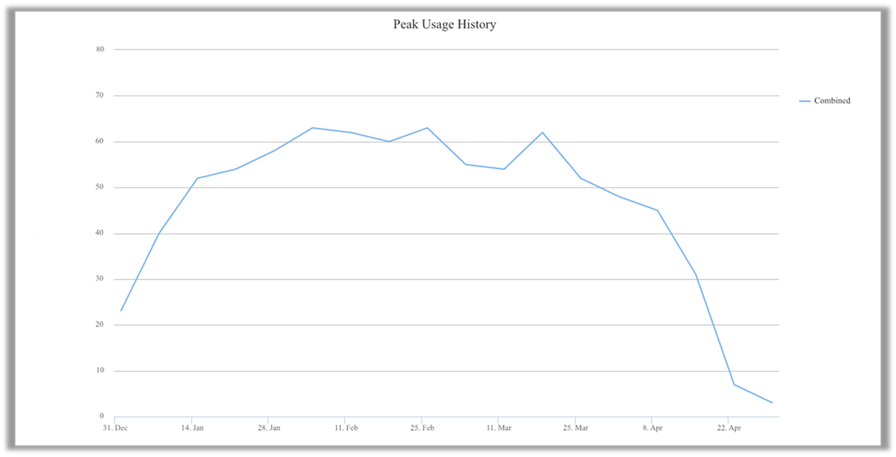
| <Insert Max Concurrent Usage graph (day of the week)> | ||||||||||
| Unique Users | Logins | Total Usage (hours) | Avg Duration (hours) | Stations Used | ||||||
| January | 1167 | 4215 | 7069 | 1.68 | 103 | |||||
| February | 1245 | 4071 | 7491 | 1.84 | 102 | |||||
| March | 1324 | 5318 | 9795 | 1.84 | 98 | |||||
| April | 905 | 2153 | 5951 | 2.76 | 122 | |||||
| Total | 2300[1] | 15757 | 30306 | 1.92[2] | 123 | |||||