| Distributed Stations | |||||||
|
|
|||||||
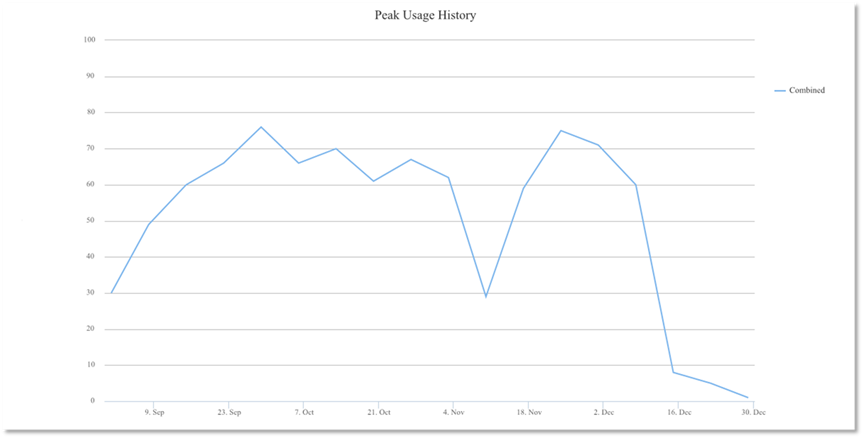
| <Insert Max Concurrent Usage graph (day of the week)> | |||||||
| Unique Users | Logins | Total Usage (hours) | Avg Duration (hours) | Stations Used (Total: 103)[1] | |||
| September | 1363 | 5228 | 7786 | 1.49 | 103 | ||
| October | 1628 | 6962 | 11825 | 1.70 | 102 | ||
| November | 1316 | 4814 | 9088 | 1.89 | 101 | ||
| December | 906 | 2491 | 5884 | 2.36 | 101 | ||
| Total | 2542[2] | 19495 | 34583 | 1.77[3] | 103[4] | ||