| Distributed Stations | ||||||||||||
|
|
||||||||||||
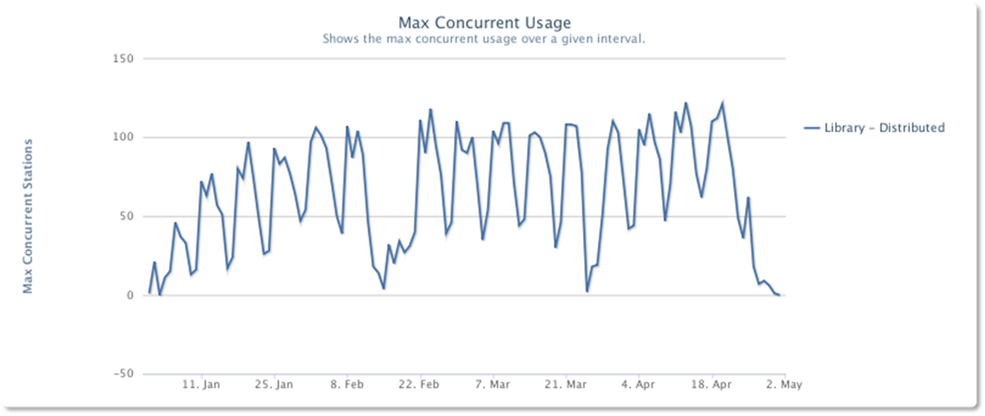
| <Insert Max Concurrent Usage graph (day of the week)> | ||||||||||||
| Unique Users[1] | Logins | Total Usage (hours) | Avg Duration (h:m:s)[2] | |||||||||
| January | 1703 | 7152 | 10903 | 1:31:28 | ||||||||
| February | 1926 | 8326 | 15077 | 1:48:39 | ||||||||
| March | 2032 | 10402 | 18873 | 1:48:51 | ||||||||
| April | 1827 | 8507 | 18418 | 2:09:54 | ||||||||
| Total | 3258[3] | 34387 | 63271 | 1:50:27[4] | ||||||||